Network Graph Analysis
What is it?
The Network Graph allows you to view Network nodes and links visually, to reveal connections and gain insights. This allows you to explore and analyse the Network, to spot linkages, patterns, trends, and anomalies.
As you explore the network, you can refine and edit the network by creating, editing, merging or deleting nodes and links.
Video: Explore Network Graphs
Click below to view a video that explains how to explore Network Graphs.

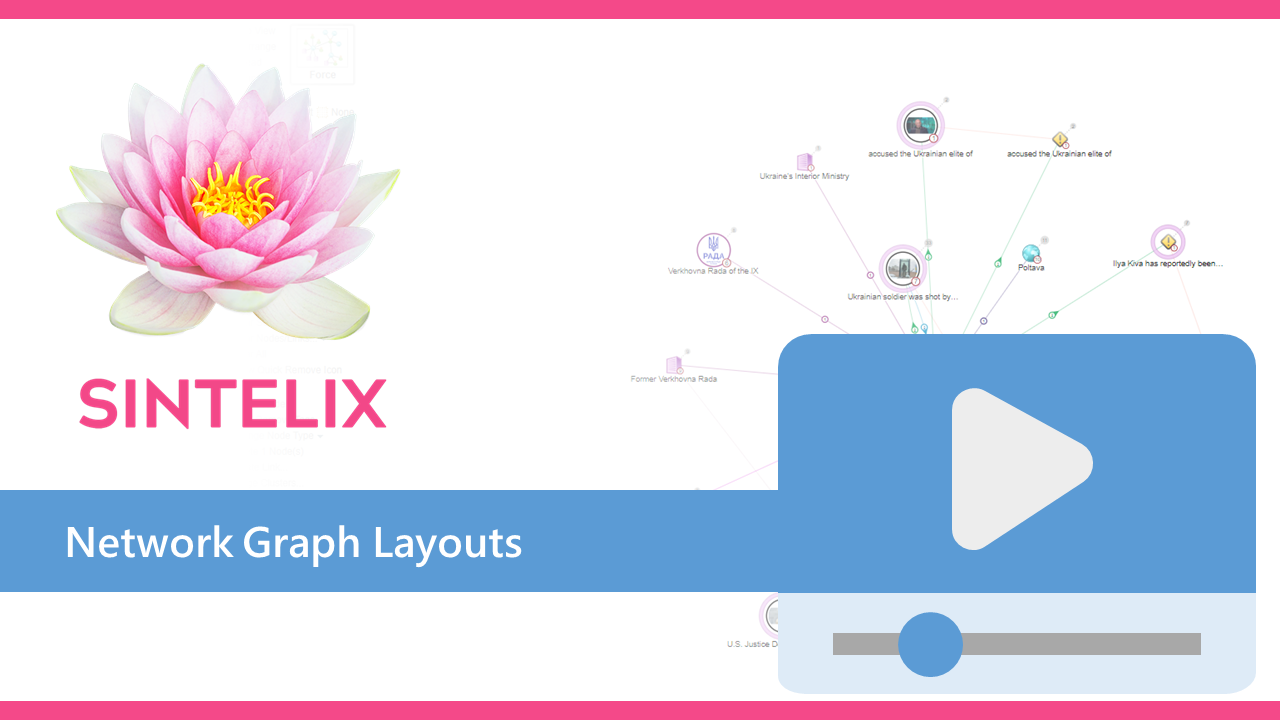
Video: Network Graph Layouts
Click below to view a video demonstrating the different Network Graph layouts.
Access the Network Graph
When viewing a Network, the Network Table view is displayed by default.
Select the Network Graph tab  to change to the Graph view.
Start a Network Graph
A Network Graph is empty until you add your first node or link.
Select the Show Graph icon ![]() to add objects to the Network.
to add objects to the Network.
This ![]() icon is displayed in the Actions column in Table view or from within the Timeline view.
icon is displayed in the Actions column in Table view or from within the Timeline view.
If you hold the SHIFT key down as you select the Show Graph icon ![]() , you can add multiple nodes/links to the graph.
, you can add multiple nodes/links to the graph.
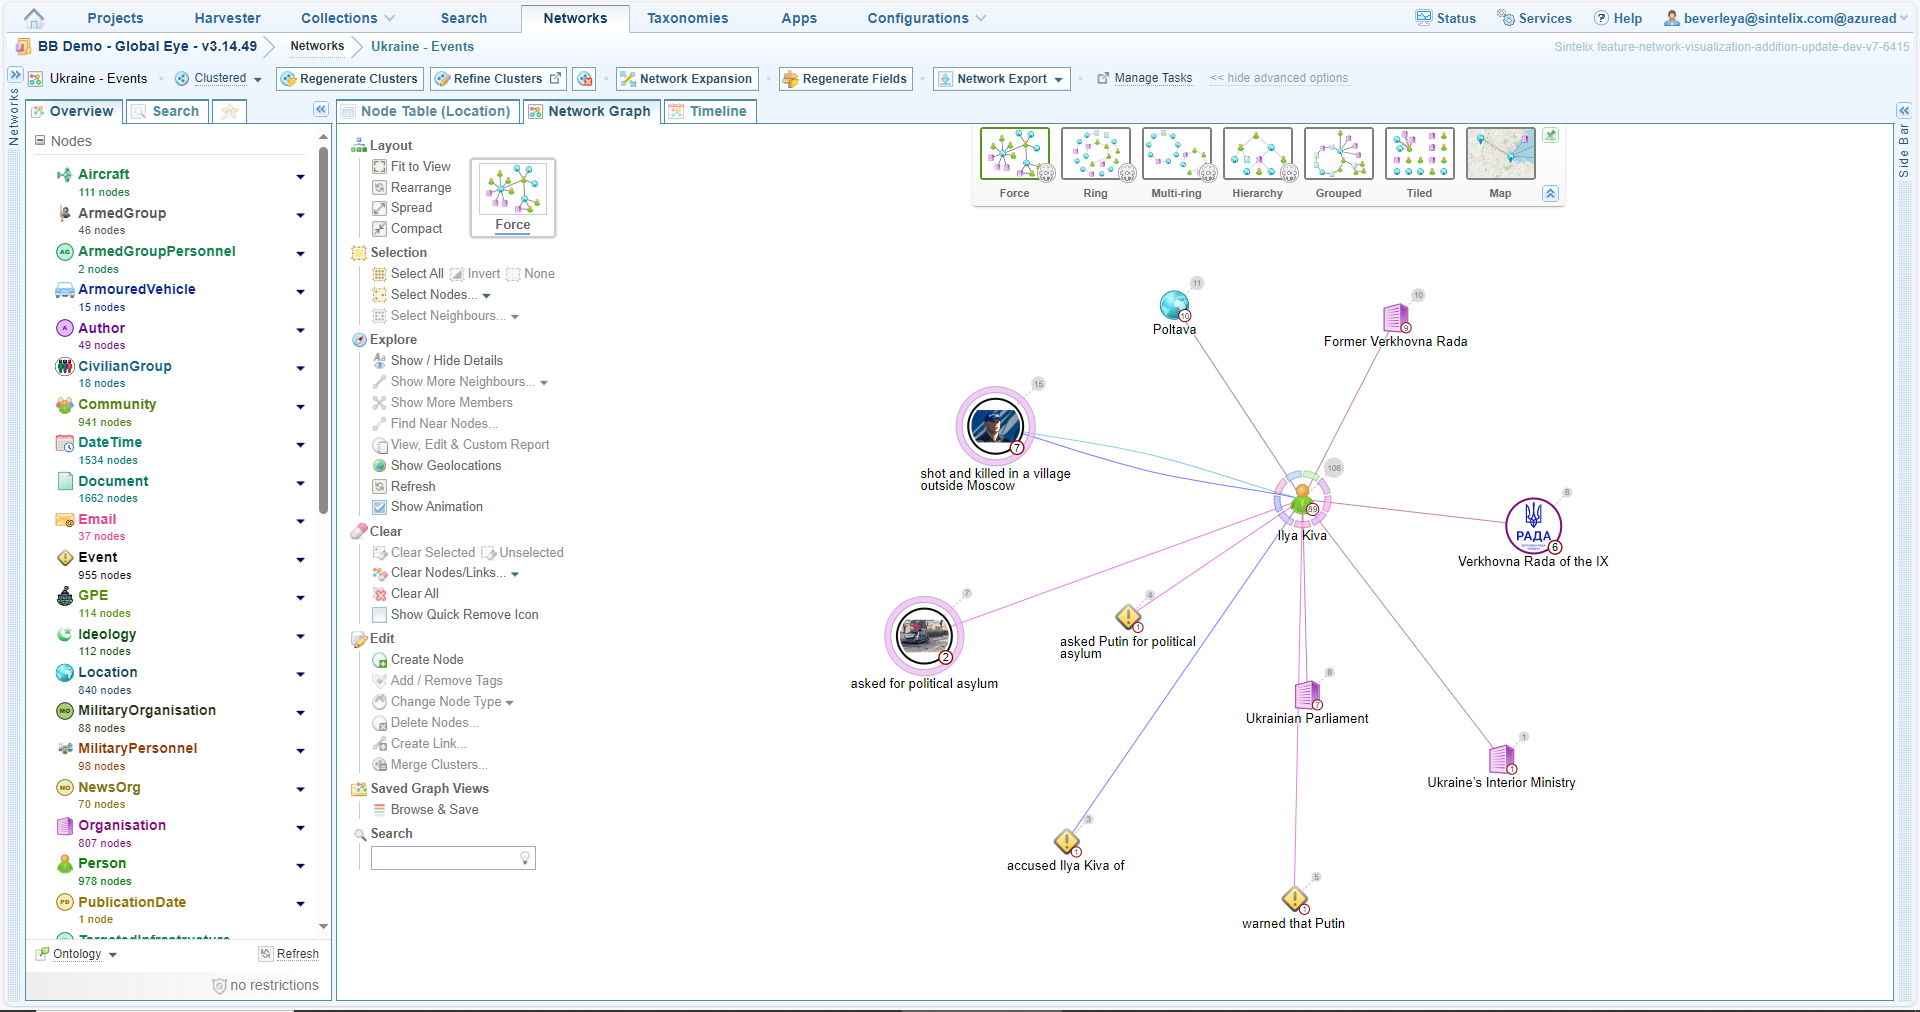
Features of a Network Graph
Understanding the features of network graphs will help you explore graphs.
|
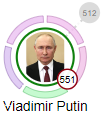
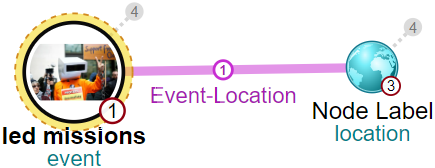
Nodes are represented as circles. A node may have an icon or initials, or in some cases, an image. The icon is assigned in the Ontology configuration. Clicking on a node, selects the node and highlights all nodes directly connected to that node. Other un-connected nodes and links are dimmed. Right-clicking on the node opens the Node menu. |
|

|
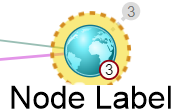
The number in the red circle represents the number of documents referenced by the node. | |

|
The number in the grey circle represents the number of neighbours not currently displayed in the graph. Clicking on the grey circle opens the Show More Neighbours dialog. |
|
|
Some nodes have coloured bars around them, indicating tags. Hovering over a colour bar will display the tag. Clicking on the colour bar will open the Add / Remove Tags dialog. See Edit Tags |
|
|
The coloured line between nodes represent links. Each type of link has a different colour. The number represents the link strength. Hovering over the link displays the link type (as shown here). Clicking on the link opens the Link menu. |
Saving and Loading a Network Graph
You can save a Network Graph so you can return to it at a later time.
You can also save over a previous saved graph, rename a saved graph and delete a saved graph.