Timeline Graph
What is it?
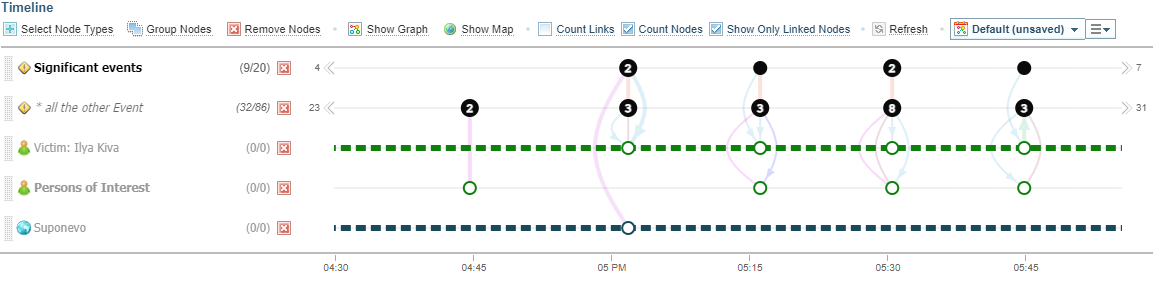
The Timeline Graph graphically displays the nodes and links organised along a timeline.
Quick Demo: Timeline Graph

Click on image to open in full window.
Features of a Timeline Graph
Understanding the features of network timelines will help you explore timelines.
|
|
Nodes are represented as circles. Each entity type will have a different colour. |
|
|
|
A solid node is a node with a temporal (datetime) attribute. |
|
|
|
A solid node with a number represents a number of nodes with a temporal (datetime) attribute. |
|
|
|
A hollow circle is a node which does not have a temporal attribute. | |
|
|
A coloured line between nodes represents a link. Lines are dimmed when unselected. A thin line represents a single link. |
|
|
|
A thick line represents multiple links of the same type. |
|
|
|
When there is more than one type of link connected, multiple lines are shown with some curving. Each type of link has a different colour. |
|
|
|
When a link is selected, the line is no longer dimmed. |
|
|
|
When a node is linked to more than one temporal node, a thick dashed line is used to connect the nodes. For example, a Person (who has no temporal data) is linked to multiple events (with temporal data) on the timeline. |
|
|
|
The arrows with numbers on each end of a node graph line indicates there are more nodes beyond the current timeframe limits. |
|
Timeline Graph options
The Timeline Graph options include:

|
Creates a new Network Graph adding all nodes and links currently displayed in the Timeline. Hold the SHIFT key and select Add to Graph to add to an existing graph. |

|
Opens the Map pane, showing all geographic node locations displayed in the current Timeline. As you change the timeframe (zooming in or out, or moving along the timeline), the locations will be updated in the Map pane. See Map Views. |

|
When selected, the nodes show the number of connected links. |

|
When Count Nodes is selected, the nodes show the number of nodes at that point of the timeline. When both Count Links and Count Nodes are selected, the nodes show the total number of links plus nodes. |

|
When selected, only displays nodes in the "* all the" node type lines that are linked to individual node lines. |

|
Refresh reloads the timeline. This can be useful when edits or changes have been made to nodes/links. |
Right-click shortcut menus
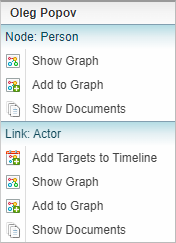
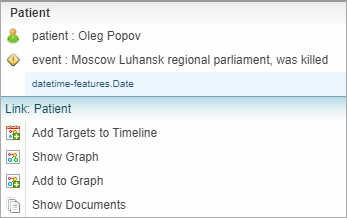
Right clicking on a node or link will display a shortcut menu. The menu displayed depends on whether the:
-
a individual non-temporal node with only one link
-
single link line
-
temporal node with at least one link or
link line with multiple links
Shortcut Menu Options
While the shortcut menus shown may vary, the options are similar.
|
|
Adds the node or linked node to the timeline. |
|
|
Creates a new Network Graph adding the node / link selected. |
|
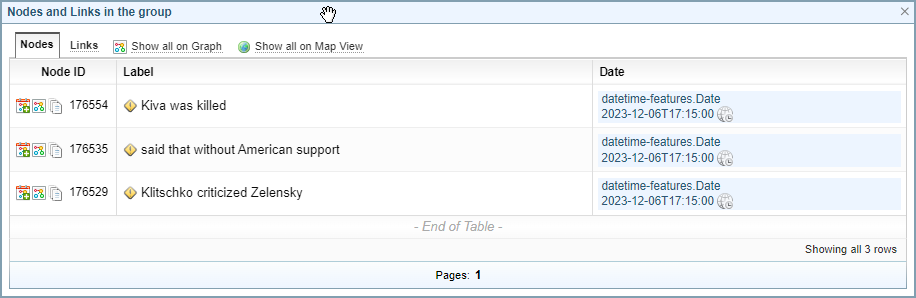
Creates a new Network Graph adding the nodes and links listed in the dialog. |
|
|
Hold the SHIFT key and select Add all to Graph to add the nodes and links listed in the dialog to an existing graph. |
|
|
Hold the SHIFT key and select Add to Graph icon to add the node/link to an existing graph. |
|
Select Add to Graph icon to add the node/link to an existing graph. |

|
Opens the Map pane, showing all geographic node locations displayed in the current Nodes and Links in group dialog, including those not on the current page of the dialog. See Map Views. |
|
|
Opens the Documents tab in the Side Bar panel. See Documents. |


 or
or