The Text Graph Analyser
The Text Graph Analyser assists users to test the configurations they create on examples of text and enables them to drill down within the Text Graph to understand how their configuration is working (or why it isn't).
The panes of the Text Graph Analyser are revealed when you click Save & Test from a configuration editor. The buttons shown below are at the bottom of the editor pane used for Dictionaries, Entity Extraction Scripts and Document Processing Scripts.

Using Text Graph Analyser
Selecting the Document Processing configuration
Creating a text graph involves running the document processing workflow which requires selection of a Document Processing configuration.
The Document Processing configuration sets up what configurations (for example, from Dictionaries, Entity Extraction Scripts, etc.) are applied in the document processing workflow.
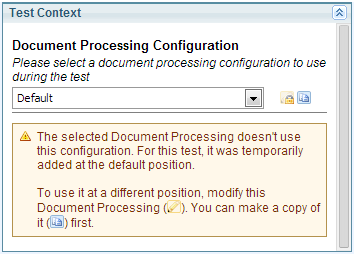
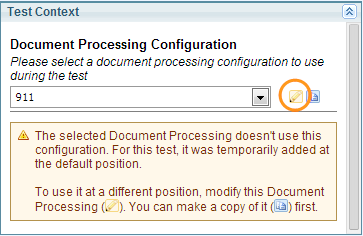
At the "Text Context" pane choose the configuration you want using the dropdown selector.
If the configuration selected is editable, you can edit it by clicking the Edit icon:
Running the Document Processing workflow
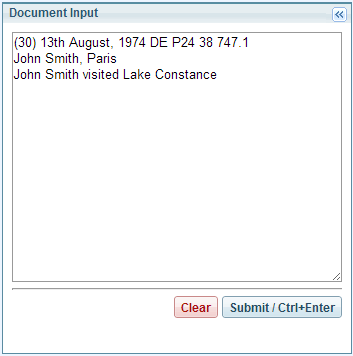
Put the text you want to analyse with your configuration in the Document Input pane and click Submit to run your text through the document processing workflow.
Ctrl-Enter is a keyboard short cut
Visualising a document
In configuration development, it is often useful to see a whole document in the analyser - without having to copy all the text into the document input window - and preserving the formatting of the document. Do this by inserting the following directive into the Document Input pane:
##SINTELIX@DOCUMENT-ID:document_ID
where the document_ID can be found from the document listing table:
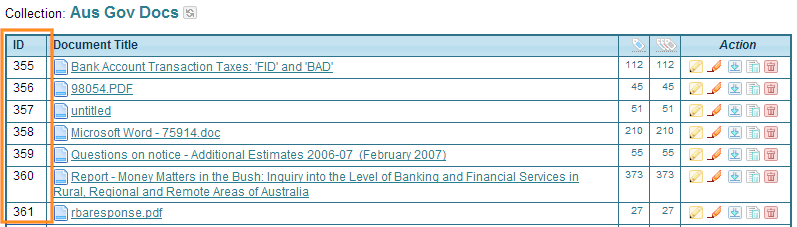
To visualise document 358, the input pane would look like:
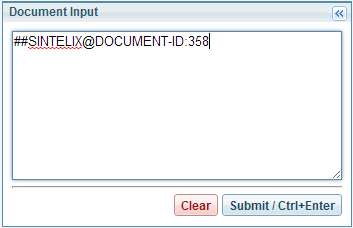
Click Submit - and the document will be analysed.
Partially Executing the Document Processing workflow
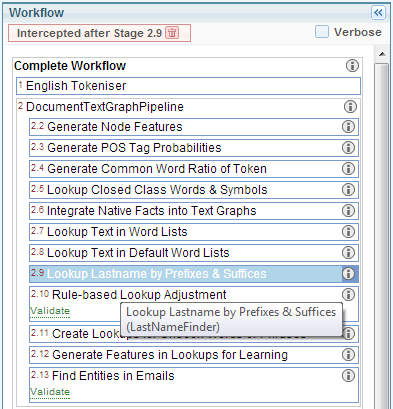
Text Graph Analyser has the ability to run the Entity Extraction workflow and stop it at any stage.
This enables you to view the text graph at any point along the workflow.
Click the stage you want to inspect, for example 2.9 in the workflow below, and then run the Text Graph analyser in the normal way.
When you want to clear the interception point, click on the trash can icon at the top of the workflow listing.
Viewing the processed document
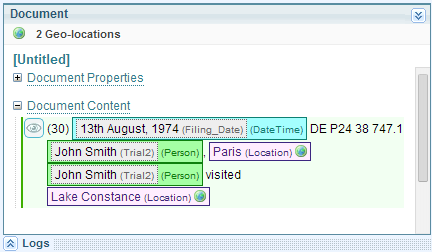
The processed document, showing any output text references is visible in the document pane:
If the workflow is partially executed (see above), text references will not be displayed in the document view.
It is an ordinary document pane, save that it has additional view and currently viewed icons, ringed below:
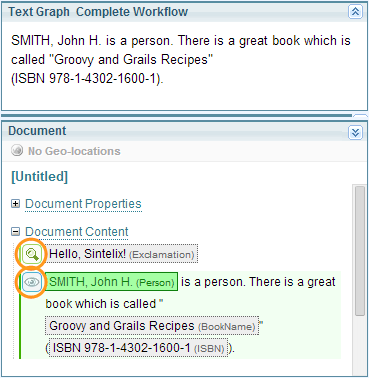
Clicking a looking glass icon next to a text block runs the text graph analyser on that text block. The icon then becomes the eye icon to indicate which text block is currently being analysed.
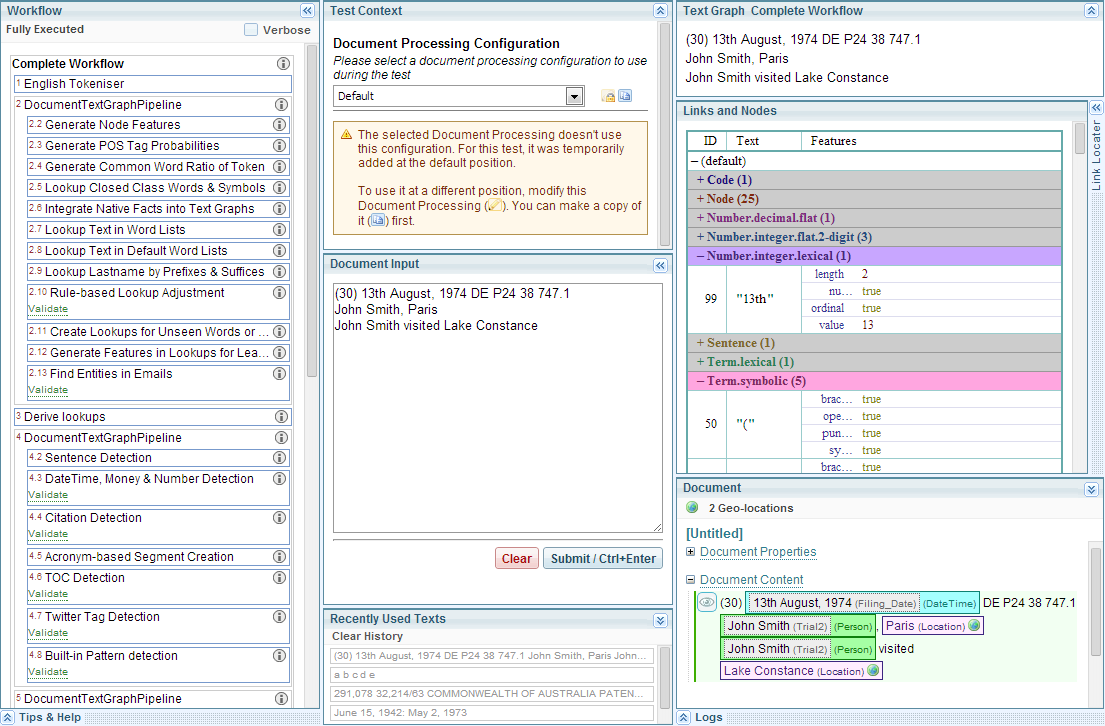
Viewing the Text Graph
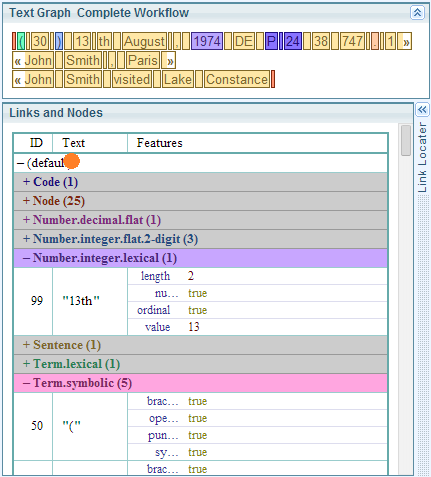
The core of the text graph analyser is the Text Graph pane. The Text Graph ribbon indicates whether the complete workflow is being run, or whether it has been intercepted before its final stage.
Below the text graph pane is the Links and Nodes pane. This lists all the nodes and links on the text graph, together with their features, and the label (if available) of the rule that created them.
The text graph is usefully interactive. As the cursor moves over link/node categories on the Links and Nodes table, the links show up on the Graph. Here the cursor covers the root node of the link tree "(default)" and all the links and nodes are highlighted on the graph:
Viewing Links and Nodes
The branches of the link tree can be opened by clicking them with the mouse. The instances of each link type are listed together with their features.
Deleted nodes are listed under the "Deleted" category.

The Link Locator
In the text graph pane, if you are interested in a particular text token, for example, "August" below, click it to reveal the Link Locator pane, which lists all the links overlapping the token.
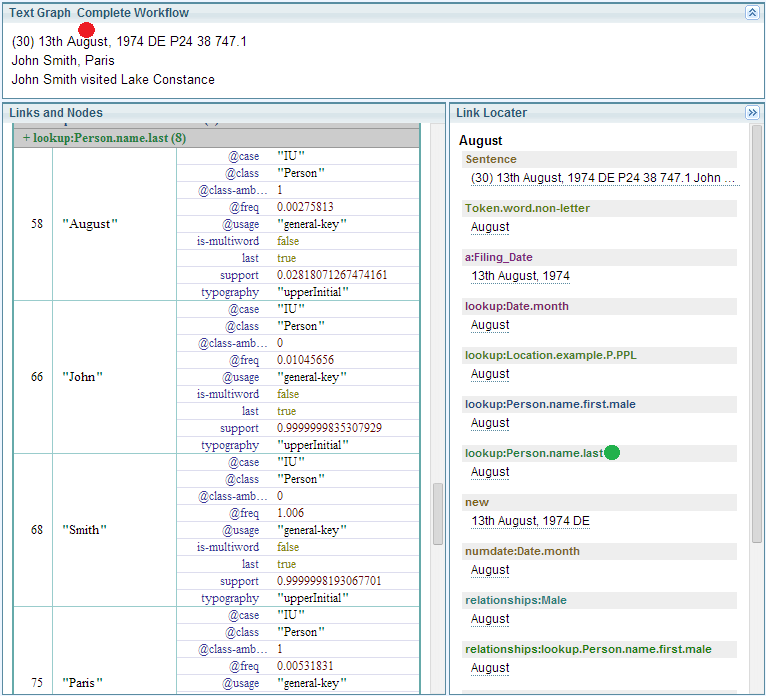
Click on a link name in the Link Locator pane (for example, "lookup:Person.name.last", above) to navigate the Links and Nodes pane to its entry for that link.
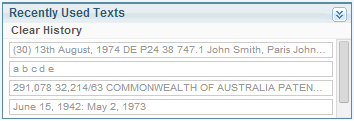
Using History
The analyser keeps history of the texts applied for reuse:
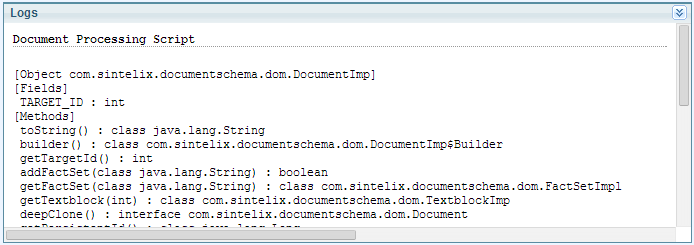
Logs
Some configurations (for example, Document Processing Scripts) can generate logs, which are sent to the log pane:
Testing the scripts with Text Graph analyser
A number of Sintelix configurations involve testing scripts such as Entity Extraction Scripts (EESs) and Dictionaries with the Text Graph analyser.
For information on the text graph see The Text Graph
No matter the script type the process is identical. Here we provide an example for testing EESs.
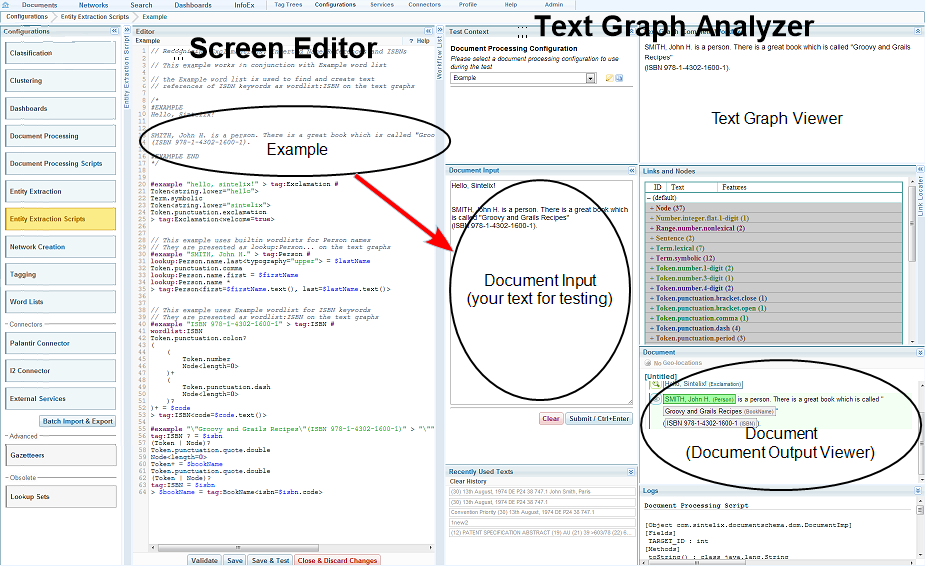
Testing Entity Extraction Scripts
The EES configuration tool is equipped with a screen editor and a testing tool, illustrated below:
Try it out first using the "Example" EES supplied with Sintelix:
- Select and load the Example EES by clicking it in the EES listing.
- The Example EES code will appear in the screen editor (as above).
- Within EES scripts you can place example text that will automatically be loaded into the Text Graph analyser's "Document Input" pane when the EES is run.
- To save and test an EES, click the "Save & Test" button at the bottom of the screen editor pane.
- The Document Input text is processed and the Sintelix document output is shown in the "Document" pane.
- The Document pane shows the text references (highlighted text) that result from processing the document through the workflow including the EES under development (in this case "Example")
- The Text Graph viewer and the Links and Nodes listing provide a rich resource for understanding how your script has operated on the input text.
- To run the same script on other text, just add to or replace the text in the Document Input pane and click "Submit" or type Ctrl-Enter.
- To find out more about the Text Graph analyser, click the link.