Network Graph Indicators
Network Graph Indicators are a measure of a Cluster Node's "centrality" - how central it is in the Network. There are three predefined centrality measures offered by these indicators, Betweenness, Closeness and Degree.
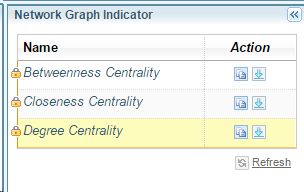
The defined Network Graph Indicators are available for use as source for Generated Fields. The predefined indicators measure centrality for Person- and Organisation-Cluster Nodes.
Usage in network field selection : dividing the centrality values by the maximum value for that centrality yields a centrality range between 0.0 and 1.0. The centrality values themselves are not necessarily useful because of their arbitrary range.
The particulars of each centrality measure are discussed below. The complexity of the calculations increases from Degree to Closeness to Betweenness, they will be discussed in that order.
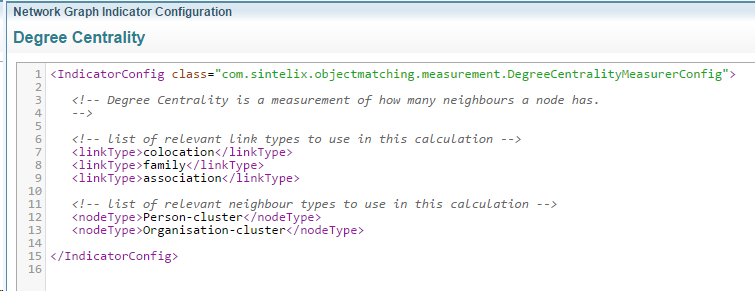
Degree
This is a simple measure that counts the number of neighbours that a Cluster Node has.
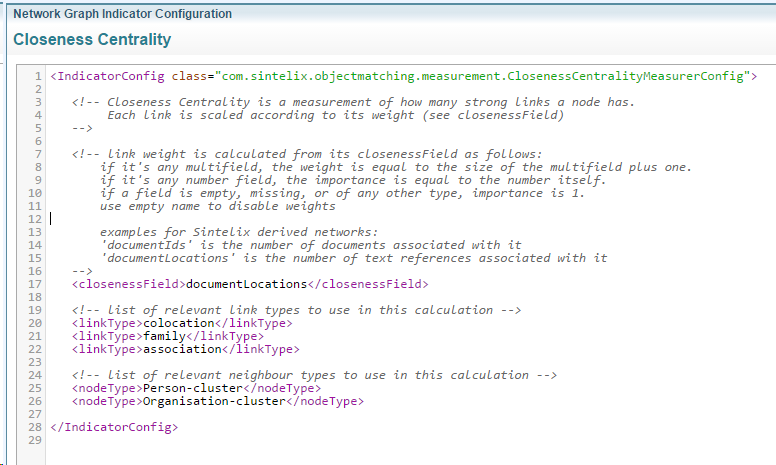
Closeness
Closeness is calculated from the number of relationships with neighbours that a Cluster Node has. This is subtly different from Degree, in that the number of times a relationship is mentioned in the documents determines the weight.
The default closenessField is documentLocations (a field of the Cluster Node) which is a multifield (that is, it has multiple values, therefore its size is the count of the number of values that it contains). [This comment should help to explain the comment text in the image below].
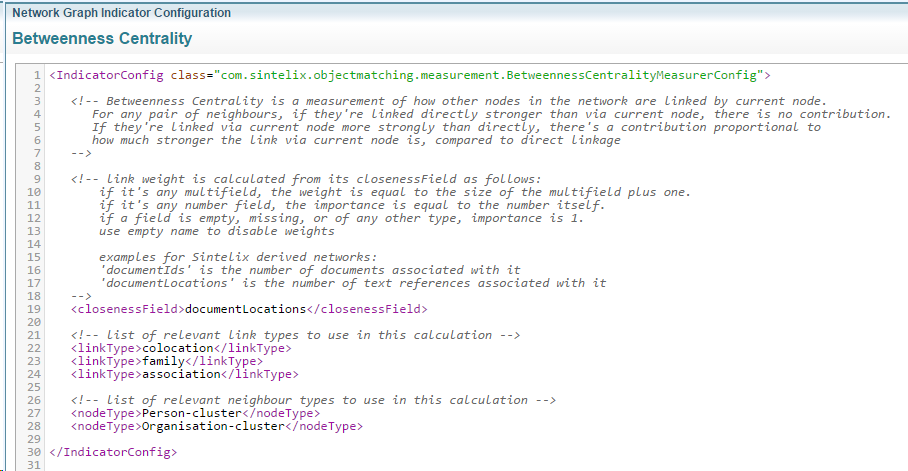
Betweeness
Betweenness is a refinement of Closeness that discounts the weight of each relationship between a Cluster Node and a pair of neighbour Nodes by the weight of the relationship between them.
The default closenessField is documentLocations (a field of the Cluster Node) which is a multifield (that is, it has multiple values, therefore its size is the count of the number of values that it contains). [This comment should help to explain the comment text in the image below].